 Fraunhofer Institute for Ceramic Technologies and Systems IKTS
Multimodal analysis and automated evaluation of cathode quality
Current research
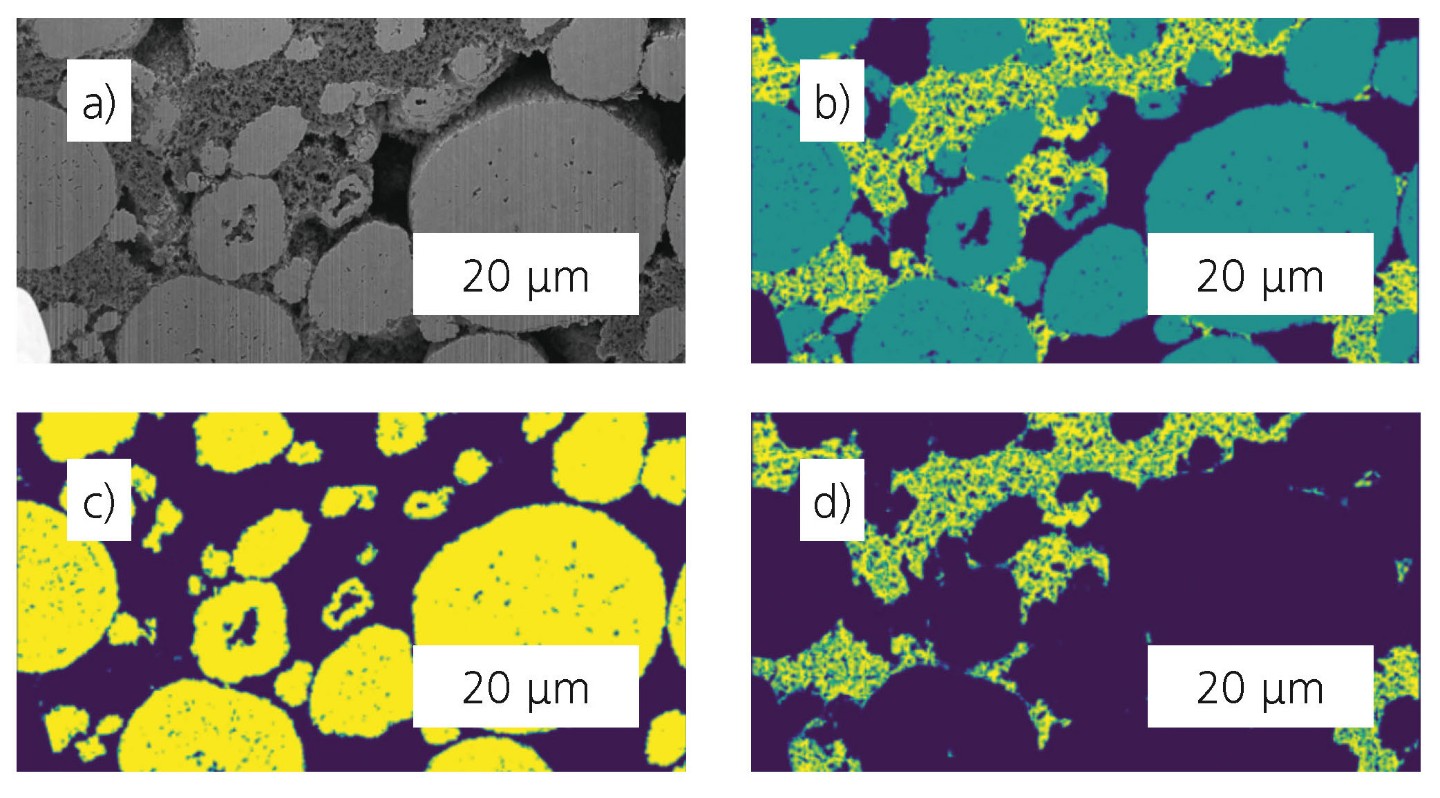
Model predictions on unseen data, a) unseen data, b) model predictions, c) active material, d) binder.
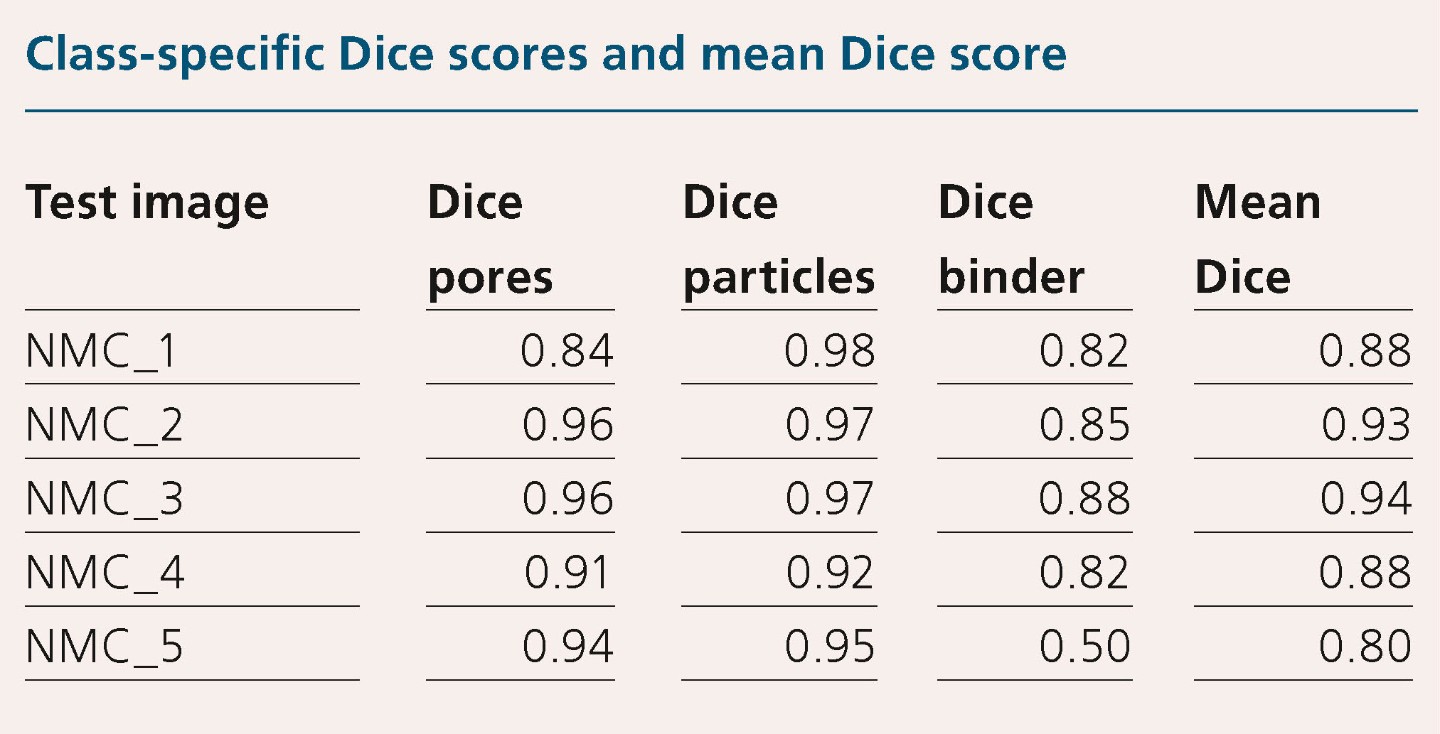
Class-specific Dice scores and mean Dice score.
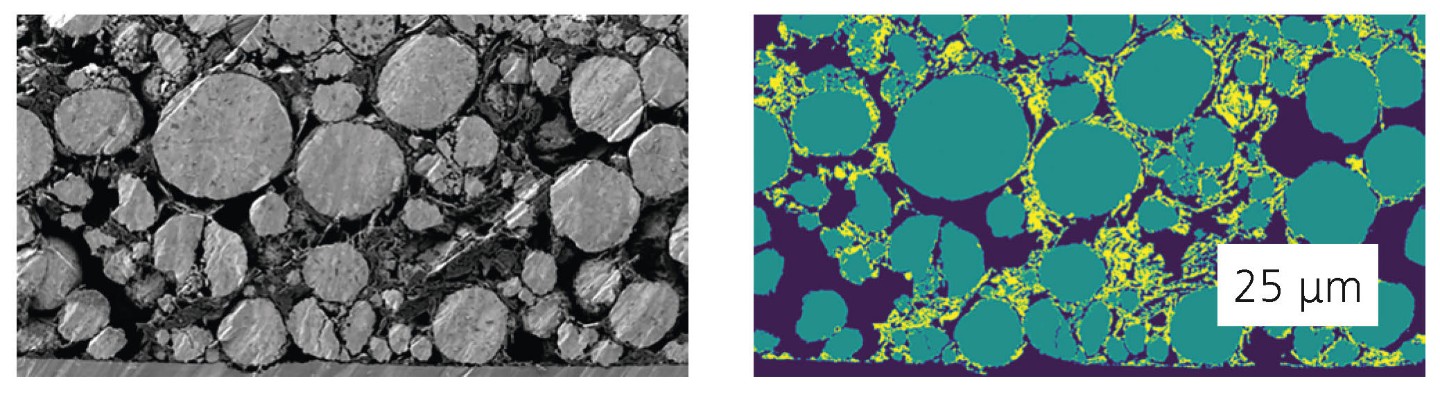
Example of model prediction on the test dataset with NCM particle size distibuton after connected-component analysis: (left) raw test image; (right) multi-class prediction masks: green (NCM particle), yellow (binder), dark violet (pores).
In its pursuit of accelerated battery development, Fraunhofer IKTS is following an automated approach to assessing cathode quality with the help of machine learning (ML). This should provide a close feedback loop between component development, cell design, characterization and data analysis. The ML model is trained to identify and classify the different material components of a cathode: NCM (nickel cobalt manganese, active material), conductive additives, pores, and binder. This process helps to optimize the components faster and more systematically, enhancing the overall performance of the batteries.
To create a robust dataset for ML-training, 60 images with varying resolutions are extracted from FIB-SEM tomography. This is achieved by sequential slicing with a focused ion beam and imaging with the scanning electron microscope. The volumetric data is generated based on these images. A U-Net-based segmentation model is applied to differentiate the defined classes within the cathode SEM image.
Before it can identify components accurately, a segmentation network requires training data. However, manually annotating high-resolution images is very labor-intensive. To address this, we employ incremental learning. At first, a basic model undergoes training on an initial dataset and is then used to make predictions on unprocessed images. These predictions are then manually reviewed and corrected to create ground truth annotations. This process is repeated to expand the dataset gradually. In this case 60 SEM images are annotated in total with varying resolution and divided into subsets: 45 for training, 15 for validation, and five for testing. During training, the images are split into patches (256 x 256 pixels), shuffled, and used as a batch size of 16. Training continues for 50 epochs, and the Dice score – the statistical measure of similarity between results of the algorithm and the reference data – is calculated for each model. The model with the highest Dice score during validation is chosen for testing. Figure 1 shows a model evaluation based on test images and unseen data to assess the model.
The performance of the automated cathode evaluation model on the test dataset has yielded promising and satisfactory results as shown in Table 1.
After obtaining predictions on test data, class-specific masks are analyzed to count instances and measure sizes. This helps generate statistical data such as size distributions and class ratios. For example, it can reveal whether NCM particles have fragmented during manufacturing (Figure 2).
The integration of machine learning into cathode characterization and optimization offers an efficient automated solution for optimizing energy storage systems. This approach has the potential to revolutionize the battery industry by providing researchers and industry professionals with a valuable tool for a faster and more cost-effective development of energy storage solutions.